Deployment: hardware, execution context, communication
A deployment says where the parts of a system run: on which processor, in
which program, on which thread. archec then checks it, predicts its timing, and
can follow it while it runs. The same system can have several deployments.
A first deployment#
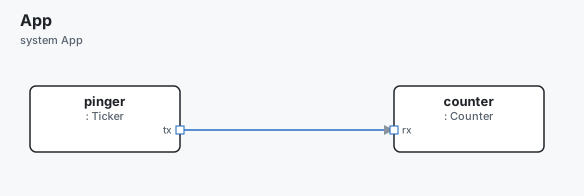
Two parts: pinger sends PING every 5 ms, counter receives it. Both run on
one microcontroller.
message PING { n: uint16; period 5ms }

component Ticker {
  out tx: data sends PING
  fn tick { wcet 1ms }
}

component Counter {
  in rx: data receives PING { depth 8 }
  fn count { wcet 200us }
}

component Mcu {
  kind processor
  compute { cores 1; os freertos }
}

system App {
  part pinger:  Ticker
  part counter: Counter
  pinger.tx -> counter.rx
}

system Board {
  part mcu: Mcu
}

deployment D {
  system App
  platform Board
  binary fw on mcu {
    thread fast { runs pinger; period 5ms; step tick; priority 2 }
    thread slow { runs counter; priority 1; queue 8 }
  }
  chain ping { through pinger, counter; budget 10ms }
}
Read it from the top:
Appis the logical system: what the parts are.Boardis the platform: the hardware.Mcuis a processor with one core and FreeRTOS.Dputs the programfwon the processor. It has two threads.fastrunspingerevery 5 ms and calls itstick.slowrunscounterwhen a message arrives.wcetis the worst-case execution time of a function. The timing analysis starts from it.- A
chainis a path through the parts with a time budget, end to end.
Check it and ask for its timing:
archec check main.arche
archec analyze main.arche
✓ no errors
Deployment D
Threads
thread where prio C T D R
fast mcu/cpu0 2 1ms 5ms 5ms 1ms ok
slow mcu/cpu0 1 200us 5ms 5ms 1.2ms ok
Cores
mcu/cpu0 24 % (RM bound 82.8 %) fast, slow
Chain ping
pinger fast wait ≤ 5ms run 1ms → 0ns (same-process)
counter slow wait ≤ 0ns run 1.2ms
worst case 7.2ms — budget 10ms okC is the execution time, T the period, D the deadline and R the worst-case
response time. archec analyze exits 1 when a core is overloaded, or when a
deadline or a chain budget can be missed.
Three questions kept apart#
The logical model (a system) says what the parts are. Three more questions are
kept apart from it, so the same system can be deployed more than one way.
Hardware: where things run.
- A processor is a component with cores (
cores 8,core safety { type "Cortex-R52" }), anosandram. - A bus is a component with
kind busand abitrate. - Put them in a platform
system.
Execution context: what runs.
- A
deploymentplacesbinarys (programs) on processors. - A binary has
processes. A process is an address space. There are no processes on an RTOS. - Processes have
threads andisrs (interrupt handlers). Each takespriority,period,deadline,coreandstack. - A thread
runsparts. Their functions, handlers and state machine execute on that thread, one at a time.
Communication: how two parts talk, on ports and links.
patternsays who waits and how many receive:fire-and-forget(the default),request-reply,pub-suborbroadcast.buffersays what the receiver keeps:queue(withdepthandoverflow),sampleorstream.timeout,deadline,stale-after,reliabilityandtopiccomplete them.
A larger deployment, on two processors and a CAN bus:
deployment Vehicle "L4 stack on the vehicle" {
  system Car                        // what runs
  platform CarHw                    // where

  binary adas "adas-stack" on adcu_soc {
    process driving { core cpu2; thread drive { runs adcu; priority 80 } }
  }
  binary brake_fw "brake.elf" on brake_mcu {      // FreeRTOS: tasks, no process
    thread ctl { runs brakes; period 1ms; step regulate; priority 10 }
  }
  route adcu.can_brake -> brakes.can over chassis_can { priority 3 }
  chain obstacle { through adcu, brakes; budget 100ms }
}
The whole example is examples/autonomous-car/deployment.arche.
How a link is carried#
The transport of each link follows from where its two ends run:
- on the same thread;
- in the same process;
- on the same processor, at the processor's
ipc-latency; - on another processor, through the link's
routeover a bus.
A link between two processors with no route is an error.
What the linter reports#
- a part with behaviour that runs nowhere;
- a core that the processor does not have;
- a bus that does not reach both processors;
- patterns that do not match on the two ends;
- a request with no handler for it;
- an unbounded queue on an RTOS;
- mixed safety levels in one address space.
What archec analyze computes#
archec analyze (and the editor) computes:
- the load of each core, and fixed-priority response times, from
wcet,periodandpriority; - the load of each bus, from message sizes and periods;
- the worst-case latency of each
chain, against its budget.
Measured timing#
You can then measure what the system really does, and compare it with the prediction.
archec gen --target c --trace(or--target embassy --trace) puts trace points in the generated code. They record each thread's activation and completion, the messages, the bus frames and the chains.- Run the program. It writes a trace.
archec timing main.arche <trace…>reads the traces, or any Chrome trace JSON. For each thread it shows the period, jitter and response time. It also shows each core's load, each bus's load and each chain's latency, beside the prediction.
Worse than predicted means the analysis is optimistic: a wcet is too small.
Over a deadline or a budget is a miss. See examples/timing, and
examples/greenhouse for a trace from a board (or Renode) over its UART.
Built live (make LIVE=1, or -DARCHE_TRACE_LIVE), the C writes each trace
line on stdout as it happens. Among these lines is the state each part's machine
enters, for example arche-trace <ns> state counter.Seen 0. A running system
can then be followed (see Live).
Execution and memory#
A thread is an active object: it runs its parts one message at a time, from its queue.
queue 32sizes that queue. On an RTOS, a thread woken by messages should say it.affinity cpu1, cpu2gives the cores the thread may run on, when onecoredoes not say it.- A thread may also run one port of a part.
runs sink.metricshandles that port's messages on this thread, not on the part's thread.
A part that no thread runs can still run: place it in a process. It is then:
passive: it runs in its callers' threads;- or
protected: it runs in its callers' threads, one caller at a time.
execution active says that the part needs a thread of its own.
Memory comes from allocators.
- A processor says its memories:
memory ddr { size 1GiB; shared }(amemorywith no type and no address). - An
allocatorin the deployment, a binary or a process takes its blocks from one of these memories, or from aparentallocator. - A
placethen says where a part's memory comes from, for each use:hrt: its real-time data;lrt: the rest;savedandtmp: an algorithm's working memory;comm: what its ports marshal.
- A dataflow port's
bufferingsays how big its buffers are, whether consumers copy or share them, when they are freed and where they come from.
deployment Target {
  allocator heap { kind heap; block-size 1MiB; memory cpu.ddr; shared }
  binary chain on cpu {
    options mygen { orb "rteorb" }
    process main {
      allocator frames { kind pool; block-size 4KiB; blocks 32; parent heap; alignment 64 }
      thread work { runs chain; priority 50; queue 32; affinity cpu1, cpu2 }
      thread watch { runs sink.metrics; queue 8 }
      place log { execution protected; memory hrt frames }
      place chain.f1 { memory saved frames; memory tmp frames }
      place chain.split.input {
        memory comm frames
        buffering { max-size 4KiB; transfer copy; destroy after-processing; allocator frames }
      }
    }
  }
}
The linter reports:
- an active part that no thread runs, and a passive part that a thread runs;
- a thread that runs an out port;
- an allocator of another process;
- an allocator in a local memory that is
mapped; - overflows: a child allocator larger than one block of its parent, more uses than blocks, a buffer larger than a block, allocators larger than their memory.
A buffer that is shared and freed once sent is an error: its consumers would read freed memory.
options <generator> { … } on a binary (or a process) sets that generator's
options for it only, over the project's. options { … } sets them for any
generator. The generator model gives each binary and each process its resolved
options. See examples/signal-chain.
Live#
archec live main.arche runs a deployment's containers and shows the model's
status while they run.
- It runs the containers under podman. The generated C is traced live
(
--target containerd). - It follows their logs and
podman stats. - Each requirement, chain, thread and container is
pass,failorpending.
What fails what:
- A chain over its budget fails the requirement it
satisfies. - A late thread, or a container over its
memory-limit, fails what its parts satisfy. - A runtime monitor's line
arche-trace <ns> monitor REQ-1 1fails REQ-1.
Options:
--jsonstreams the state, one JSON per line, each item with its file and line. The editor reads it.--once --duration 30sis a CI gate.--replay trace.logevaluates traces already written.
Containers#
A container holds binaries instead of putting them straight on the
processor. It needs a Linux processor whose compute gives runtime containerd. The container's image is named after its id. Its binaries take its
on.
It also says its cgroup and sandbox:
- the cores it may use (
core, its cpuset); memory-limit;network host,bridgeornone;- the host
devices it sees (/dev/ttyS1); - Linux
capabilities:sys_niceforpolicy fifothreads,allfor a privileged container; - environment variables (
prop NAME = "value").
container driving "registry.local/l4/driving:0.3" on adcu_soc {
  core cpu2, cpu3, cpu4, cpu5; memory-limit 4GiB; network host
  capabilities sys_nice; prop RUST_LOG = "info"
  binary adas { language rust; thread drive { runs adcu; core cpu2; priority 80; policy fifo } }
}
A container with a memory-limit counts once against its processor's ram.
Its processes are checked against that limit. A link between two containers
costs the processor's ipc-latency. When one of them is on a bridge network,
it costs that container's latency.
The linter reports:
- a container on a non-Linux processor, or on one with no runtime;
- a thread outside its container's cores;
- a real-time thread without
sys_nice; - a link leaving a
network nonecontainer; - a container on a CAN bus without
network host(SocketCANcan0is a network interface, not a device); - a container on another bus (a serial line) that sees no device;
- a binary inside a container that also says
on.
archec gen --target containerd writes the images and the compose files.
--target k8s writes the Kubernetes (k3s) manifests that run them, each pinned
to its processor's node (see Code generation).
One container per process#
packaging container puts every process in a container of its own, without
writing each one. Each process of a binary on a Linux processor gets a
container:
- named after the process, on that processor;
- with the process's core(s) as the cpuset, and its
memory-limit; - on the host's network;
- with
sys_nicewhen one of its threads is real-time.
A binary's threads that are in no process share one container, named after the binary. Containers you write out stay as written: write one out to give it an image, a device or another network.
deployment Vehicle {
  packaging container
  binary adas on adcu_soc {
    process driving { core cpu2; memory-limit 4GiB; thread drive { runs adcu; policy fifo } }
    process island { core safety; thread guard { runs adcu.brakes_path } }
  }
}
In the Arche project#
The containers of the simulated deployment go to containers.yaml: processor,
cpuset cores, memoryLimit, network, latency, image, devices,
capabilities and env. A process in a container, or a thread with no process,
says container: <id> and keeps its own target and core. Arche's Hardware page
groups the threads of each core by their container.
Limits#
- The timing analysis starts from the
wcetyou write. It does not measure it: awcetthat is too small gives an optimistic prediction. Compare with a measured trace (archec timing). archec liveruns containers with podman only.- Containers need a Linux processor with
runtime containerd. - Arche's simulation runs the threads of a container like any other thread. The container groups them on the Hardware page only.